4. Results
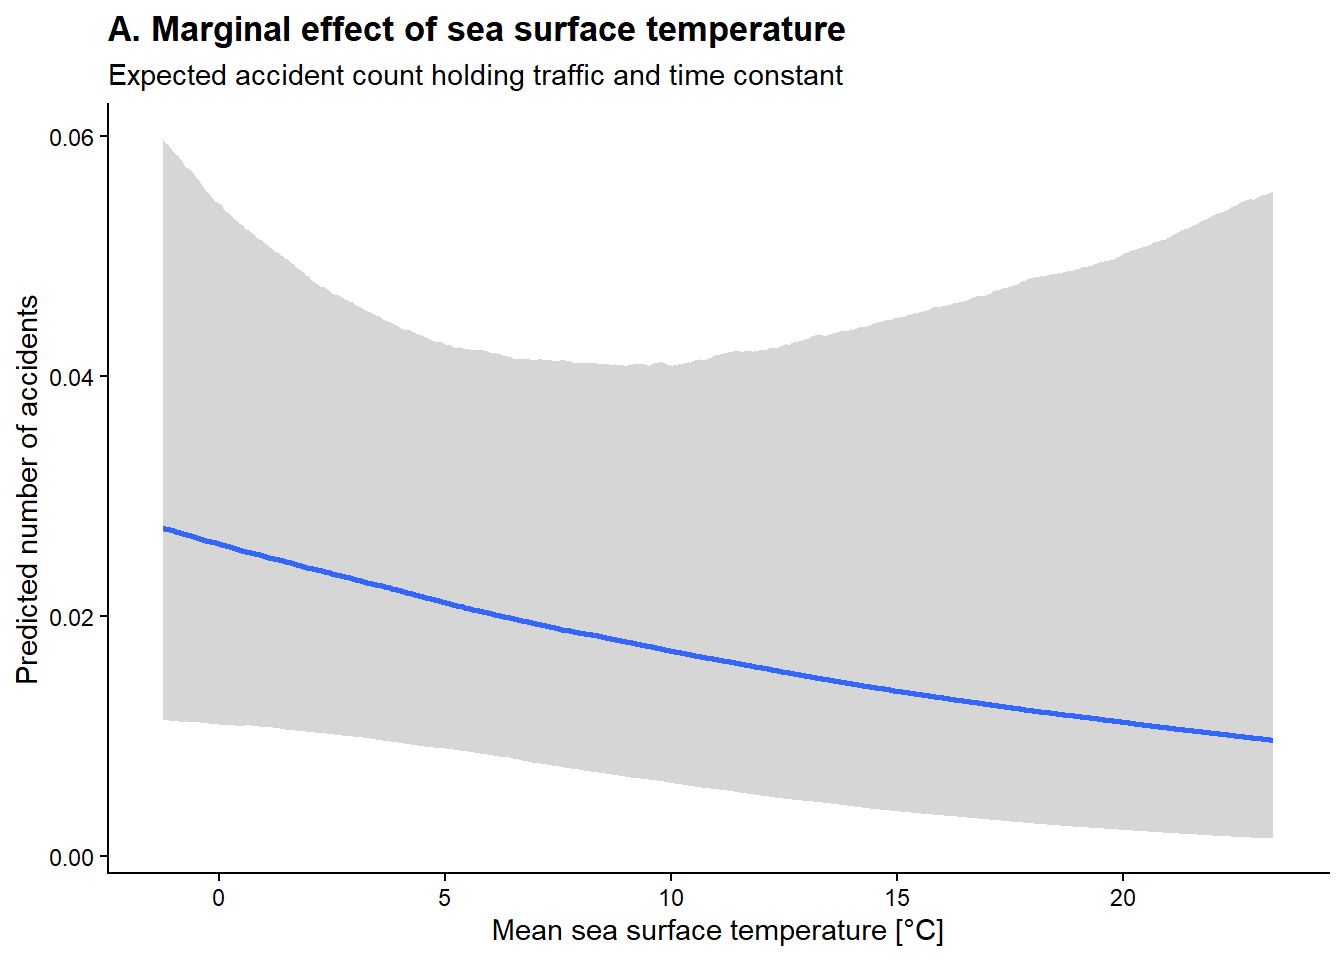
Figure S4. Conditional effect of sea surface temperature (SST). The plot illustrates the marginal effect of SST on the expected number of maritime accidents per grid cell, with all other predictors held at their reference levels and the traffic offset held at its median. The shaded area represents the 95% Bayesian credible interval. Although a slight downward trend is visible, the wide credible intervals encompassing zero indicate no substantial, independent thermal effect, supporting the hypothesis that modern navigational technologies effectively mitigate freezing-related risks.
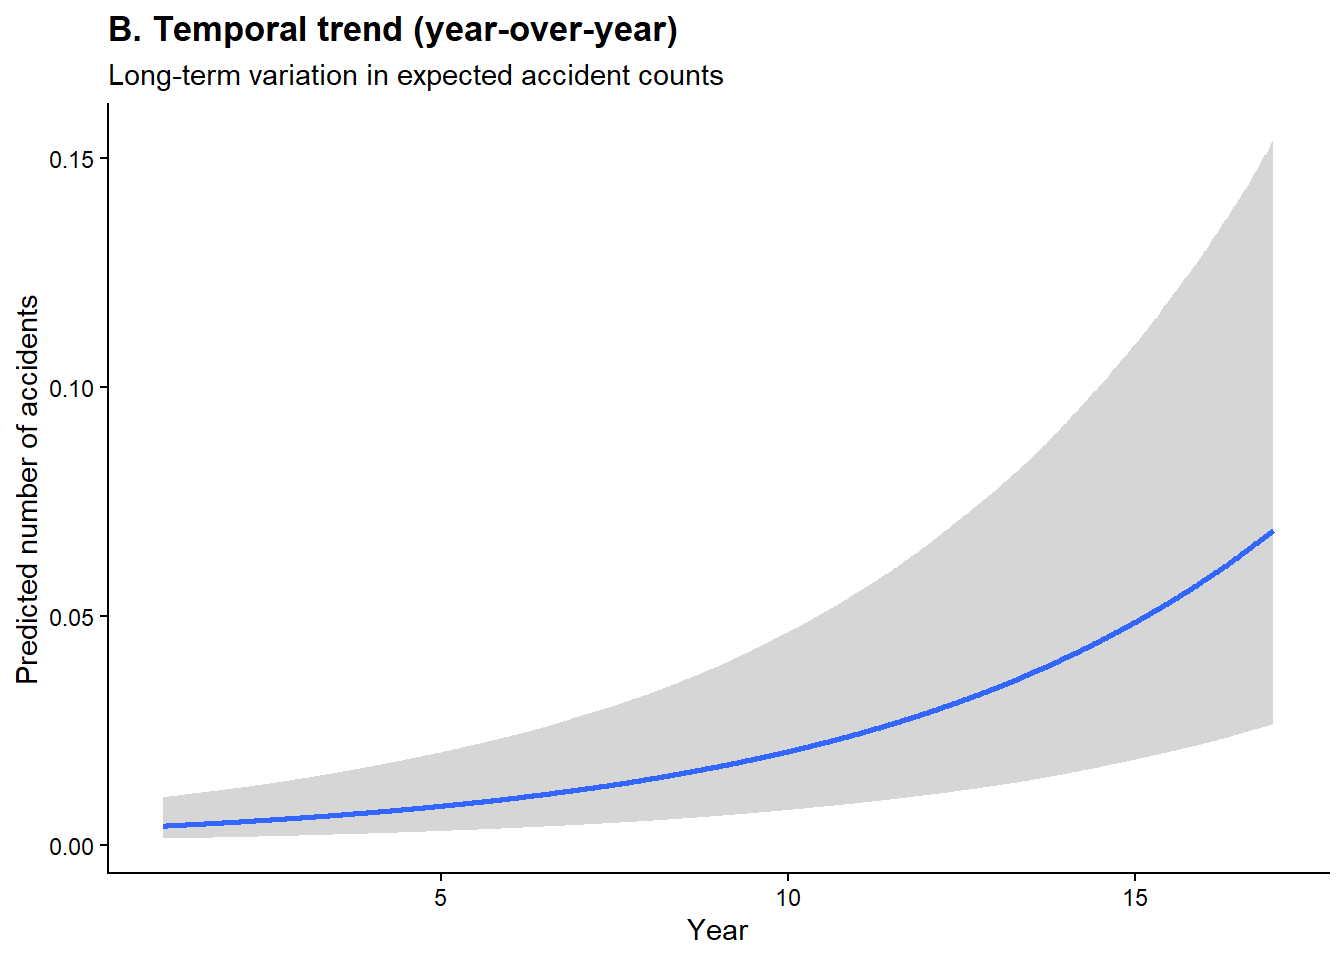
Figure S5. Long-term temporal trend of accident risk. The partial dependence plot displays the estimated continuous effect of time (year_num) on accident frequency. The visible, credible upward trajectory indicates a systematic, underlying increase in baseline accident risk over the studied period (approx. 18.5% year-over-year). This increase is independent of fluctuations in vessel traffic volume, pointing toward external latent factors such as fleet aging or increased reporting strictness (e.g., EMSA EMCiP implementation).
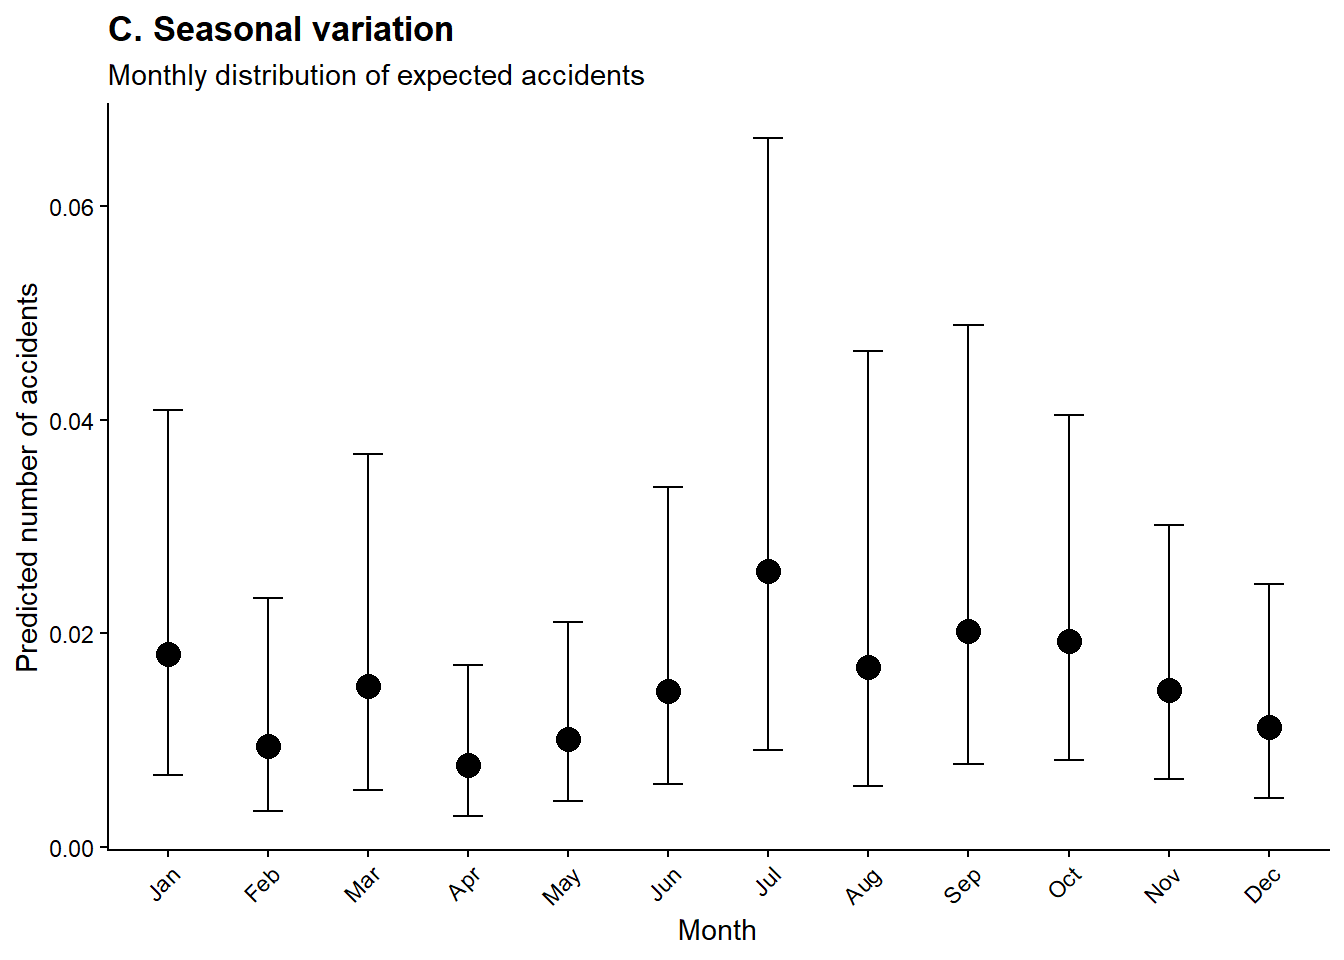
Figure S6. Seasonal variations in expected accident counts. Point estimates with 95% credible intervals showing the isolated effect of specific months on accident probability. January serves as the high-risk baseline. Paradoxically, peak icing months (February, April) exhibit a substantial drop in baseline risk, reflecting the Risk Homeostasis Theory—whereby severe winter conditions prompt risk-compensating behaviors, such as convoy systems and heightened crew vigilance. A secondary peak is observable in summer (e.g., July), driven by distinct mechanisms such as recreational traffic congestion.